Packaging Colour and its Influence on Consumer’s Purchase on Beverage Industry
1Mr Goutam Manishi, Post Graduate Research Scholar, Department of Fashion Management Studies, National Institute of Fashion Technology, Ministry of Textiles, Government of India, Daman Campus
2Ms Anuja Yogesh Kulkarni, Post Graduate Research Scholar, Department of Fashion Management Studies, National Institute of Fashion Technology, Ministry of Textiles, Government of India, Daman Campus
3Dr Vidhu Sekhar P, Asst Professor, Department of Fashion Management Studies, National Institute of Fashion Technology, Ministry of Textiles, Government of India, Daman Campus
- INTRODUCTION
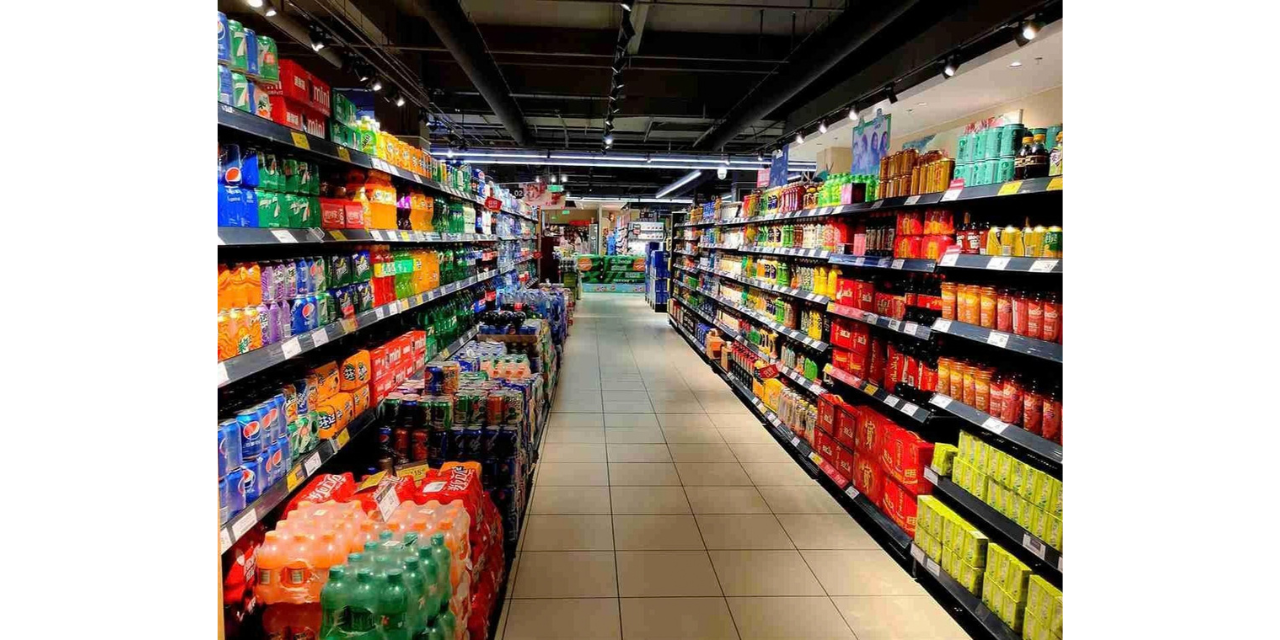
Packaging is one of the first points of contact between a beverage brand and consumers, as its visual appearance can create expectations about taste, quality and brand identity even before consumption. In the competitive beverage industry, packaging can influence how a product is noticed, interpreted, and evaluated, with colour functioning as both a sensory and visual cue that may create flavour associations, shape expectations, and differentiate products. This relationship is particularly relevant to beverages because the visible colour and appearance of the drink can become part of the overall packaging experience and influence consumer impressions at the point of purchase.
The present study therefore examines packaging colour as a potential influence on consumer response in the beverage industry. The research began with a preliminary field visit to observe how consumers encounter and respond to beverage packaging in a real retail environment; these observations helped identify specific consumer responses for further investigation, which were subsequently examined through existing academic literature to establish the conceptual basis of the study.
- QUALITATIVE STUDY
During the preliminary stage of the study, we encountered American Delight Basil Seed Drink with Passion Fruit Juice, whose partially transparent packaging allowed the colour of the beverage to remain visible and become part of the overall packaging experience. This observation led us to explore whether the visible colour of a beverage could influence consumers before consumption, prompting a retail visit where interaction with shopkeeper suggested that the product’s appearance could attract customers and encourage first-time trial or purchase. At the same time, the shopkeeper identified Mogu Mogu as a more frequently ordered beverage, highlighting a distinction between visual curiosity that may encourage trial and repeat-purchase behaviour that may develop through familiarity or previous experience.
This observation was used only as a basis for further investigation and not as evidence of causality. The field visit therefore shifted the research focus from simply asking whether packaging colour is attractive to examining how consumers respond to the visual appearance of a beverage, particularly whether it creates expectations about taste, contributes to brand recognition and memory, influences perceptions of product quality, and encourages immediate or unplanned purchase decisions. Based on these observations, four areas were identified for further investigation: Taste Association, Brand Recall, Impulse Buying, and Perceived Product Quality.
- RESEARCH OBJECTIVES
3.1. To examine the influence of packaging colour visibility on consumers’ taste expectations and associations with a beverage.
3.2. To analyse the influence of packaging colour visibility on consumers’ perception of beverage product quality.
3.3. To examine whether packaging colour visibility contributes to brand recognition and recall among consumers.
3.4. To assess the influence of packaging colour visibility on consumers’ impulse buying and purchase-related responses.
3.5. To compare consumer responses across different levels of packaging transparency – transparent, semi-transparent, transparent + opaque and opaque.
- LITERATURE REVIEW
Following the preliminary field visit, a literature review was conducted to examine whether the four consumer responses identified during the exploratory stage were supported by existing research. The review examines previous studies related to Taste Association, Brand Recall, Impulse Buying & Perceived Product Quality, providing the academic foundation for understanding how packaging colour may influence different aspects of consumer response.
4.1. TASTE ASSOCIATION
Spence & Velasco (2018) examined the multiple effects of packaging colour on consumer behaviour and product experience across food and beverage and other product categories. Their work describes packaging colour as an important visual cue that can communicate sensory expectations, including expectations about taste and flavour, with broader attributes such as naturalness, healthiness and premium positioning. This supports the view that colour can create a taste-related expectation before the consumer experiences the actual product.
Huang & Lu (2015) investigated how package colour influences expectations of food taste and healthiness. In a within-subject experiment involving 40 participants and 12 food products, red packaging was associated with greater expectations of sweetness, while green and blue packaging were associated with perceptions of healthiness. The study demonstrates that consumers can infer intrinsic product attributes from an extrinsic visual cue such as package colour.
Wang and Chang (2022) examined the effect of packaging colour on expected and perceived taste using popcorn packages in red, blue, yellow and white. Sixty participants evaluated different taste conditions before and after tasting. The study found colour–taste associations, with red and yellow packaging associated with sweetness, blue with saltiness, and white with a more neutral/tasteless expectation. The findings also showed a difference between pre-tasting expectations and post-tasting perceptions, highlighting the psychological influence of packaging colour before consumption.
Sant’Anna and colleagues (2022) studied coffee packaging using black, red, green, yellow and contrasting colours with 432 volunteers through free word association. The research found that packaging colours could induce important sensory and hedonic expectations about coffee. Black, red and green packaging generated relevant coffee-related associations, while some other colours were less compatible with the expected characteristics of the product. The study demonstrates that colour–taste associations can depend on the product context and consumers’ existing associations.
VisioNxt’s Paridhi 24×25, consistently indicates that packaging colour can act as a visual cue for taste and flavour expectations. Different colours can activate learned or culturally shaped associations before consumption, although the strength and direction of these associations can vary by product category and consumer experience. Therefore, Taste Association is included in the present study to examine whether changing only the packaging colour of the same beverage changes consumers’ expectations of its taste.
4.2. BRAND RECALL
Bezaz (2014) investigated whether packaging colour affects children’s brand-name memorisation, distinguishing between recall and recognition. The experiment involved 160 French children aged 7–12. The study found that chromatic packaging positively affected brand recognition, although it did not produce the same effect on brand recall. The research therefore highlights that colour can support brand recognition while recall and recognition should be treated as distinct memory outcomes.
Kanani, Menon and Shah (2020) examined the importance of colour–flavour associations in determining brand recall using Lay’s as the product context. A structured questionnaire tested consumers’ responses to different colour–flavour combinations. The findings indicated that consumers relied on previous colour–flavour associations and had difficulty recalling familiar brands when established colour–flavour combinations were changed. This suggests that consistent packaging colour can become part of consumers’ brand memory.
Khuong and Hong (2016) studied the impact of product packaging design on consumer repurchase intention among 293 Vinamilk consumers in Ho Chi Minh City. The research examined packaging elements including colour, materials, fonts and shape, and considered brand recognition and brand recall as mechanisms associated with repurchase intention. The study found empirical evidence that brand recognition and brand recall could predict repurchase intention, while packaging elements indirectly influenced repurchase behaviour through these brand-awareness responses.
Devle (2026) examined the impact of packaging colour on brand recall and purchase behaviour in the context of Lay’s India. The study reported that packaging colour significantly enhanced brand recall and created strong colour–flavour associations. At the same time, the findings indicated that colour did not independently determine purchase behaviour; factors such as price, perceived quality, taste preference and brand familiarity also contributed to consumer decisions. This positions colour primarily as a cognitive cue that can improve brand memory.
VisioNxt’s Paridhi 24×25, launched in September 2024, was developed as an India-specific trend forecast using artificial and emotional intelligence to identify and interpret patterns in Indian consumer culture and design. The initiative uses visual data, including colour and other product attributes, to map emerging trends and consumer preferences. This is relevant to brand recall because repeated and recognisable visual cues can contribute to how consumers identify and distinguish products within a visually competitive market.
4.3. IMPULSE BUYING
Bahreinizad and Rajabi (2018) investigated the relationship between packaging usability perceptions and impulse buying, considering packaging shape, colour, material, label and size. The study surveyed 388 consumers in Shiraz, Iran, and used structural equation modelling. The findings showed that material, shape and labelling influenced perceptions of packaging usability, while colour and size did not significantly influence usability perception in their model. Importantly, perceived packaging usability had a significant positive relationship with impulse buying. This provides a useful caution that packaging colour may not independently create impulse buying in every context.
Hubert and colleagues (2013) investigated neural correlates of impulsive buying tendencies during consumers’ perception of product packaging. The research examined whether packaging appeal could trigger responses associated with impulsive purchasing, including among consumers who had no initial intention to buy. The study supports the broader proposition that visual packaging can be involved in immediate consumer responses and impulse-buying tendencies.
Chandrasekhar, Das and Gupta (2024) examined how packaging design, colour schemes and product displays affect impulse purchases. Their research discusses packaging as a mechanism for capturing attention, communicating product information and influencing consumer perceptions at the point of purchase. The study places colour schemes and visual aesthetics within the broader set of packaging characteristics that can contribute to impulse-purchase behaviour.
Sharma (2021) examined whether matching the colour of advertising empty space with the colour of the featured product affects consumers’ buying impulse. Across three experiments involving different product categories, colours and online advertising formats, the research found that product-coloured empty space increased buying impulse compared with white empty space. Increased salience and enhanced exposure to product colour were identified as mechanisms contributing to the effect. Although the study focuses on advertising rather than physical packaging, it provides supporting evidence that colour salience can influence immediate buying responses.
VisioNxt’s Prana Yuva 25×26 examines the changing behaviour of India’s youth, describing consumption as increasingly experiential and participatory rather than purely transactional. The report highlights rising discretionary spending and digital fluency among young consumers and positions them as active participants in shaping consumption and culture. This provides a useful contemporary context for impulse buying because immediate purchase responses can occur within highly visual and experience-oriented consumption environments.
4.4. PERCEIVED PRODUCT QUALITY
Swasty and colleagues (2021) examined the effect of packaging colour schemes on perceptions, product preferences, product trial and purchase intention. Using a quantitative approach, the researchers compared different colour schemes and analysed responses using chi-square tests and one-way ANOVA. The study found that differences in colour schemes did not significantly affect every measure, but a difference was observed in perceived quality, with monochromatic schemes tending to receive higher quality perceptions than several other schemes. This indicates that colour composition can contribute to quality evaluation, although the effect is not universal.
Nascimento and colleagues (2022) examined how packaging design affects perceived quality and purchase intention for honey among 343 Brazilian consumers. Different package designs were evaluated using consumer-perception and purchase-intention measures. The study found that packaging design influenced perceived quality; honey in glass jars, for example, was perceived as healthier, tastier, higher in quality and associated with a trusted origin. The research demonstrates that consumers can use packaging as an extrinsic cue when judging product quality before or alongside product experience.
Olesen and Giacalone (2018) investigated how packaging design influences consumers’ quality perceptions of fresh carrots. In a conjoint study, 251 Danish consumers evaluated nine packaging combinations that varied packaging type and label colour. Packaging type was the strongest attribute influencing perceived quality and value, with box packages associated with higher perceived quality than plastic bags. Although colour was not the dominant factor, the study shows that packaging characteristics can function as extrinsic quality cues.
Chitturi, et. al., (2022) examined visual design elements of bottled-water packaging, particularly cap colour and bottle shape, through three experiments. The study found that a blue cap produced substantial positive changes in preference, while colour and shape combinations also affected quality perceptions. The research demonstrates that specific visual packaging elements can influence consumer preference and perceptions of quality, making colour a relevant cue in product evaluation.
VisioNxt’s Éternité: Kalpa 27×28 examines emerging consumer culture, design and future-facing consumption through an Indian perspective. The forecast uses AI-enabled foresight, cultural intelligence and design research to identify emerging product directions, including colour and material aesthetics. Its methodology highlights the role of visual and cultural signals in understanding how products are likely to be interpreted by future consumers. For the present study, this provides a contemporary contextual basis for examining packaging colour as a visual signal that may contribute to product evaluation and perceived quality.
- RESEARCH METHODOLOGY
This section describes the research approach, sampling method, data sources, research instrument, measurement scale, study variables, data collection procedure, statistical analysis, and methodological limitations adopted to examine the influence of packaging colour on consumer responses in the beverage industry. The methodology was designed to systematically collect and analyse consumer responses using a structured questionnaire and statistical analysis through JASP.
5.1. RESEARCH APPROACH AND DESIGN
The present study adopts a quantitative research approach to examine the influence of packaging colour visibility on consumer responses in the beverage industry. The study follows a descriptive and analytical research design, wherein consumer responses are collected in numerical form and subsequently analysed using statistical techniques. Four packaging conditions were considered for the study: Transparent, Semi-transparent, Transparent + Opaque, and Opaque.
The same respondents evaluated each packaging condition, allowing their responses to be compared across different levels of packaging transparency. The study focuses on four areas of consumer response identified through the preliminary field observation and literature review: Taste Association, Perceived Product Quality, Brand Recall, and Impulse Buying.
5.2. POPULATION SAMPLING METHOD & SIZE
The population of the study consists of consumers who purchase or consume packaged beverages. The study considered respondents from different age groups, genders, beverage consumption frequencies, and beverage preferences in order to obtain a broader understanding of consumer responses towards beverage packaging. A convenience sampling method was adopted for the study, wherein respondents were approached based on their accessibility and willingness to participate. This method was considered suitable for the exploratory nature of the research and the available scope of data collection.
A total of 102 valid responses were collected through the structured questionnaire and used for the analysis. The respondents represented different demographic & beverage consumption characteristics, allowing the study to examine variations in consumer responses.
5.3. SOURCES OF DATA
The study utilised both primary and secondary sources of data. Primary data were collected through two stages. First, an exploratory field visit to a retail outlet was conducted to observe beverage packaging in an actual purchasing environment and to understand consumer responses through interaction with the shopkeeper. The observations from this stage helped in identifying research problems and key areas of consumer response considered in the study.
Second, primary quantitative data were collected directly from respondents through a structured questionnaire designed around the four packaging conditions and the identified consumer-response variables.
Secondary data were obtained from academic research papers, journals, books, reports, and relevant published literature related to packaging colour, consumer perception, taste expectations, brand recall, impulse buying, perceived product quality, and consumer behaviour. These secondary sources provided the conceptual and theoretical foundation for the development of the study.
5.4. RESEARCH INSTRUMENT & MEASUREMENT SCALE
A structured questionnaire was used as the primary research instrument. The questionnaire included questions relating to respondents’ demographic characteristics, beverage purchasing behaviour, and packaging preferences, followed by statements measuring their responses towards the four packaging conditions. The consumer-response statements covered Taste Association, Perceived Product Quality, Brand Recall, and Impulse Buying. Each respondent evaluated the Transparent, Semi-transparent, Transparent + Opaque, and Opaque packaging conditions using the same set of statements.
5.5. DATA COLLECTION PROCEDURE
The questionnaire was prepared and distributed using Google Forms. Respondents were first asked questions relating to their demographic profile and beverage purchasing behaviour. They were then presented with the four packaging conditions and asked to evaluate each condition using the given Likert-scale statements. The collected responses were compiled, coded numerically, and prepared for statistical analysis.
5.6. DATA ANALYSIS & STATISTICAL METHODS
The collected data were analysed using JASP to examine the reliability, differences, and relationships present within the responses. Descriptive statistics were used to summarise the respondent profile and the responses obtained for the four packaging conditions. The internal consistency of the questionnaire items was assessed using Cronbach’s alpha (α) and McDonald’s omega (ω).
A Repeated-Measures ANOVA was employed to determine whether significant differences existed in consumer responses across the four packaging conditions, as the same respondents evaluated each condition. Pearson’s correlation coefficient (r) was used to examine the linear relationships between the selected consumer-response variables.
All statistical tests were interpreted at a 95% confidence level, with α = 0.05. A p-value of ≤ 0.05 was considered statistically significant, while a p-value greater than 0.05 was considered statistically non-significant.
5.7. LIMITATIONS
The use of convenience sampling limits the generalisability of the findings to the wider beverage-consuming population. Since the study relies on self-reported responses, individual preferences and response tendencies may influence the results. The study also examines consumer responses at a single point in time and therefore does not measure changes in perceptions or purchasing behaviour over an extended period.
- DATA ANALYSIS & INTERPRETATION
The data collected from 102 respondents were coded and analysed using JASP statistical software. The analysis begins with a description of the respondent profile, followed by reliability analysis of the measurement scales. Descriptive statistics are then used to summarise consumer responses, while repeated-measures ANOVA, Chi-square goodness-of-fit, and Pearson correlation are used to examine the distribution of preferences, differences across packaging colour/visibility conditions, and relationships among the identified consumer-response variables.
6.1. DESCRIPTIVE STATISTICS
Descriptive statistics were used to summarise consumer responses across the four packaging colour/visibility conditions using mean and standard deviation. The analysis covered Taste Association, Perceived Product Quality, Brand Recall, and Impulse Buying. Higher mean scores indicate stronger agreement with the respective statements.
| Consumer Response | Transparent | Semi-transparent | Transparent+Opaque | Opaque |
| Taste Association | 3.292 | 2.875 | 2.961 | 2.515 |
| Perceived Product Quality 3.337 | 3.033 | 3.212 | 3.007 | |
| Brand Recall | 3.268 | 3.042 | 3.180 | 3.127 |
| Impulse Buying | 3.218 | 2.831 | 3.027 | 2.841 |
The transparent packaging condition recorded the highest mean scores across all four consumer-response variables. Perceived Product Quality had the highest mean under the transparent condition (M = 3.337), followed by Taste Association (M = 3.292), Brand Recall (M = 3.268), and Impulse Buying (M = 3.218). The opaque condition generally recorded lower mean scores, particularly for Taste Association (M = 2.515). Overall, the descriptive results indicate a more favourable consumer response towards transparent packaging. These findings are further examined through reliability and inferential analysis.
6.2. RELIABILITY ANALYSIS
Reliability analysis was conducted to assess the internal consistency of the 56 Likert-scale items used to measure consumer responses across the four packaging colour/visibility conditions. Demographic and preference variables were excluded from the reliability analysis as they were not measurement items. Cronbach’s alpha (α) and McDonald’s omega (ω) were used to assess the reliability of the scale.
| Frequentist Scale Reliability Statistics | ||||
| 95% CI | ||||
| Coefficient | Estimate | Std. Error | Lower | Upper |
| McDonald’s ω | 0.9729 | 0.003835 | 0.9654 | 0.9804 |
| Cronbach’s α | 0.9728 | 0.004025 | 0.9649 | 0.9806 |
The results indicate a very high level of internal consistency, with Cronbach’s alpha of 0.973 and McDonald’s omega of 0.973. This indicates that the items consistently measure the consumer-response constructs examined in the study. Therefore, the scale demonstrates strong reliability and is suitable for further statistical analysis.
6.3. Repeated-Measures ANOVA
A repeated-measures ANOVA was conducted to examine whether consumer responses differed significantly across the four packaging colour/visibility conditions: transparent, semi-transparent, transparent + opaque, and opaque. The same respondents evaluated all four conditions; therefore, a repeated-measures design was used.
6.3.1. H₀: Consumer responses do not differ significantly across the four packaging colour/visibility conditions.
6.3.2. H₁: Consumer responses differ significantly across the four packaging colour/visibility conditions.
The analysis was conducted at a 5% significance level (α = 0.05). A p-value ≤ 0.05 indicates a statistically significant difference, while a p-value > 0.05 indicates that the null hypothesis is not rejected.
| Consumer Response | F | df | p-value | Partial n2 |
| Taste Association | 17.386 | 1.976, 199.592 | < .001 | 0.147 |
| Perceived Product Quality | 3.676 | 2.234, 225.677 | 0.023 | 0.035 |
| Brand Recall | 1.559 | 2.559, 258.497 | 0.203 | 0.015 |
| Impulse Buying | 5.394 | 2.433, 245.717 | 0.003 | 0.051 |
The repeated-measures ANOVA showed significant differences across the four packaging colour/visibility conditions for Taste Association (F = 17.386, p < .001), Perceived Product Quality (F = 3.676, p = .023), and Impulse Buying (F = 5.394, p = .003).
Therefore, the null hypothesis was rejected for these three variables. However, Brand Recall did not show a statistically significant difference across the four conditions (F = 1.559, p = .203); therefore, the null hypothesis was not rejected for Brand Recall.
Overall, the results indicate that packaging colour/visibility is associated with significant differences in consumers’ taste associations, perceived product quality, and impulse-buying responses, while no significant difference was found in brand recall.
6.4. CHI-SQUARE TEST
Chi-Square Test (goodness-of-fit) was conducted to determine whether consumer preferences were equally distributed across the four packaging types: transparent, semi-transparent, transparent + opaque and opaque. The analysis was conducted at a 5% significance level.
6.4.1. H₀: There is no significant difference in the distribution of consumer preferences across the four packaging types.
6.4.2. H₁: There is a significant difference in the distribution of consumer preferences across the four packaging types.
| Preferred Packaging | Observed | Expected |
| Transparent | 44 | 25.5 |
| Semi-Transparent | 16 | 25.5 |
| Transparent + Opaque | 31 | 25.5 |
| Opaque | 11 | 25.5 |
| Test Results | χ²(3) = 26.392, p < .001 | |
The Chi-square test showed a statistically significant difference in consumer preferences across the four packaging types, χ²(3) = 26.392, p < .001. Therefore, the null hypothesis was rejected. Transparent packaging recorded the highest preference (44 respondents), while opaque packaging recorded the lowest (11 respondents), indicating that consumer preferences were not equally distributed across the four packaging types.
6.5. PEARSON CORRELATION ANALYSIS
Pearson’s correlation analysis was conducted to examine the linear relationships among Taste Association, Perceived Product Quality, Brand Recall, and Impulse Buying. The analysis was conducted at a 95% confidence level with a significance level of α = 0.05.
6.5.1. H₀: There is no significant relationship between the selected consumer-response variables.
6.5.2. H₁: There is a significant relationship between the selected consumer-response variables.
| Variable | Taste
Association |
Perceived
Product Quality |
Brand Recall | Impulse Buying |
| Taste
Association |
— | 0.796 | 0.700 | 0.769 |
| Perceived
Product Quality |
0.796 | — | 0.864 | 0.863 |
| Brand Recall | 0.700 | 0.864 | — | 0.859 |
| Impulse Buying 0.769 | 0.863 | 0.859 | — |
The Pearson correlation results show significant positive relationships among all four consumer-response variables (p < .001). Taste Association was strongly positively correlated with Perceived Product Quality (r = .796), Brand Recall (r = .700), and Impulse Buying (r = .769). Perceived Product Quality also showed strong positive correlations with Brand Recall (r = .864) and Impulse Buying (r = .863). Brand Recall was strongly positively correlated with Impulse Buying (r = .859). Therefore, the null hypothesis was rejected, indicating significant positive relationships among the consumer-response variables.
- FINDINGS
The study examined the influence of packaging colour/visibility on consumer responses in the beverage industry across four packaging conditions: transparent, semi-transparent, transparent + opaque, and opaque. Based on the analysis of 102 valid responses, the following findings were obtained:
7.1. Taste Association: Transparent packaging recorded the highest mean score for Taste Association (M = 3.292), while opaque packaging recorded the lowest (M = 2.515). The repeated-measures ANOVA showed a statistically significant difference across the four packaging conditions (p < .001), indicating that significant differences were observed in consumers’ taste-related expectations across the packaging conditions.
7.2. Perceived Product Quality: Transparent packaging recorded the highest mean score for Perceived Product Quality (M = 3.337). The difference across packaging conditions was statistically significant (p = .023), indicating that consumers’ perceptions of product quality differed significantly across the packaging conditions..
7.3. Brand Recall: Transparent packaging had the highest mean score for Brand Recall (M = 3.268). However, the repeated-measures ANOVA did not show a statistically significant difference across the four conditions (p = .203). Thus, although transparent packaging produced a higher mean response, the difference was not statistically significant.
7.4. Impulse Buying: Transparent packaging recorded the highest mean score for Impulse Buying (M = 3.218). The ANOVA showed a statistically significant difference across the packaging conditions (p = .003), suggesting that consumers’ impulse-buying responses differed significantly across the packaging conditions.
7.5. Packaging Preference: The Chi-square test showed that consumer preferences were not equally distributed across the four packaging types, χ²(3) = 26.392, p < .001. Transparent packaging was the most preferred option, with 44 respondents, while opaque packaging was selected by 11 respondents.
7.6. Relationships among Consumer Responses: Pearson correlation analysis showed significant positive relationships among Taste Association, Perceived Product Quality, Brand Recall, and Impulse Buying (p < .001). The strongest relationships were between Perceived Product Quality and Brand Recall (r = .864), Perceived Product Quality and Impulse Buying (r = .863), and Brand Recall and Impulse Buying (r = .859).
- CONCLUSION
The study concludes that packaging colour/visibility plays an important role in shaping consumer responses to beverages, particularly in relation to taste associations, perceived product quality, and impulse-buying responses. Transparent packaging consistently recorded the highest mean scores across all four consumer-response variables and was also the most preferred packaging type.
However, the results indicate that the influence of packaging colour/visibility is not uniform across all consumer responses, as Brand Recall did not show a statistically significant difference across the four packaging conditions.
The significant positive correlations among the consumer-response variables further indicate that perceptions of taste, quality, brand recall, and purchase response are interconnected. Overall, the findings suggest that beverage brands can consider packaging visibility as an important visual cue when designing packaging intended to communicate product characteristics and attract consumers at the point of purchase.
- REFERENCES
Huang, L., & Lu, J. (2015). Eat with your eyes: Package color influences the expectation of food taste and healthiness moderated by external eating. Marketing Management Journal, 25(2), 71–87.
Sant’Anna, A. C., dos Santos Alves, M. J., Moraes Monteiro, C. R., Ribeiro Gagliardi, T., & Ayala Valencia, G. (2022). The influence of packaging colour on consumer expectations of coffee using free word association. Packaging Technology and Science, 35(8), 629–639.
Spence, C., & Velasco, C. (2018). On the multiple effects of packaging colour on consumer behaviour and product experience in the ‘food and beverage’ and ‘home and personal care’ categories. Food Quality and Preference, 68, 226–237.
Wang, C.-Y., & Chang, F.-Y. (2022). The influence of packaging color on taste expectations and perceptions. Color Research & Application, 47(6), 1426–1441.
VisioNxt. (2024). Paridhi 24-25. National Institute of Fashion Technology.
Bezaz, N. (2014). The impact of packaging colour on children’s brand name memorization. International Journal of Retail & Distribution Management, 42(11/12), 1053–1068.
Devle, A. (2026). Impact of packaging color on brand recall and purchase behavior: An empirical study of Lay’s India. International Journal for Multidisciplinary Research, 8(2).
Kanani, H., Menon, P., & Shah, H. (2020). Assessing the importance of colour-flavour association in determining the brand recall of the product (Lays). International Journal of Advanced Science and Technology, 29(5s), 2424–2433.
Khuong, M. N., & Hong, T. M. (2016). The impact of product packaging design on consumer repurchase intention: A study of VinaMilk, Vietnam. International Journal of Innovation, Management and Technology, 7(5), 219–223.
VisioNxt. (2024). Paridhi 24-25. National Institute of Fashion Technology.
Bahreinizad, M., & Rajabi, A. (2018). Consumers’ perception of usability of product packaging and impulse buying: Considering consumers’ mood and time pressure as moderating variables. Journal of Islamic Marketing, 9(2), 262–282.
Chandrasekhar, K., Das, S., & Gupta, N. (2024). Impulse buying and product packaging: Examine how packaging design, colour schemes and product displays affect impulse purchases. Humanities and Social Science Studies, 13(1), 110.
Hubert, M., Hubert, M., Florack, A., Linzmajer, M., & Kenning, P. (2013). Neural correlates of impulsive buying tendencies during perception of product packaging. Psychology & Marketing, 30(10), 861–873.
Sharma, N. (2021). The effects of matching empty ad space color to featured product’s color on consumer buying impulse. Journal of Consumer Marketing, 38(3), 262–271. https://doi.org/10.1108/JCM-10-2019-3477
VisioNxt. (2025). Prana Yuva 24-25. National Institute of Fashion Technology.
Chitturi, R., Londoño, J. C., & Henriquez, M. C. (2022). Visual design elements of product packaging: Implications for consumers’ emotions, perceptions of quality, and price. Color Research & Application, 47(3), 729–744.
Nascimento, A. G. M., Toledo, B. S., Guimarães, J. T., Ramos, G. L. P. A., da Cunha, D. T., Pimentel, T. C., Cruz, A. G., Freitas, M. Q., Esmerino, E. A., & Mársico, E. T. (2022). The impact of packaging design on the perceived quality of honey by Brazilian consumers. Food Research International, 151, 110887.
Nørgaard Olesen, S., & Giacalone, D. (2018). The influence of packaging on consumers’ quality perception of carrots. Journal of Sensory Studies, 33(1), e12310.
Swasty, W., Putri, M. K., Koesoemadinata, M. I. P., & Gunawan, A. N. S. (2021). The effect of packaging color scheme on perceptions, product preferences, product trial, and purchase intention. Jurnal Manajemen dan Kewirausahaan, 23(1), 27–39.
VisioNxt. (2026). Éternité: Kalpa 27-28. National Institute of Fashion Technology.