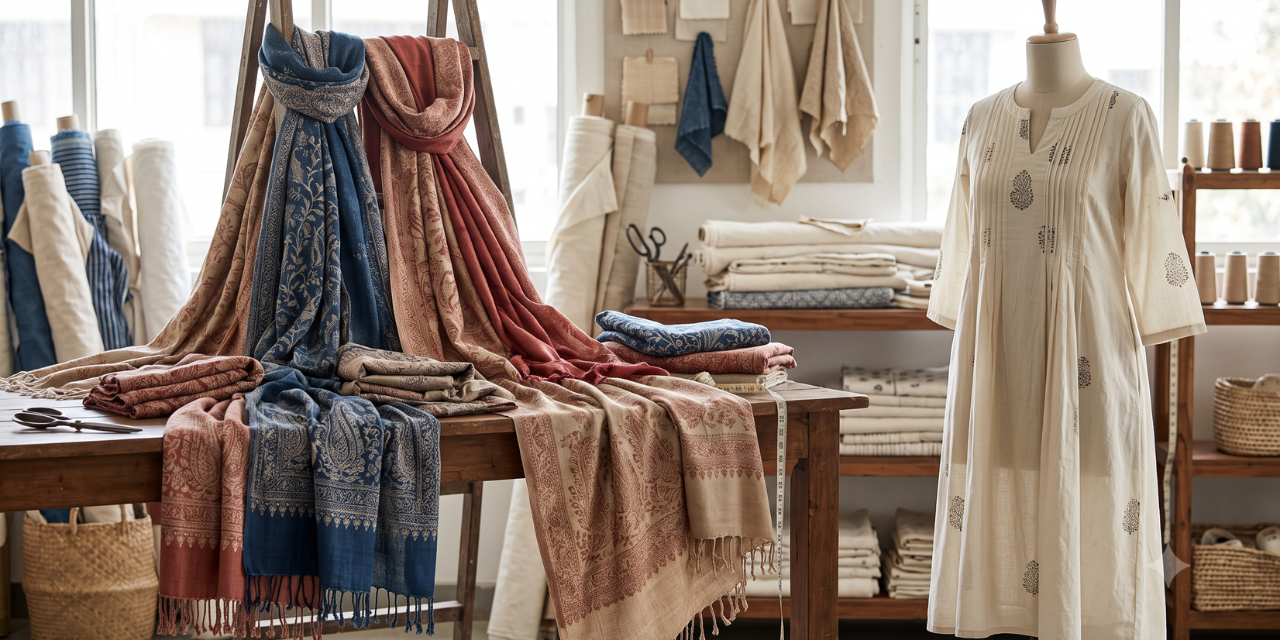
India’s Global Ranking in Scarf and Cotton Dress Exports
India ranks among the world’s leading exporters of scarves and women’s cotton dresses. In 2024, India ranked fourth in scarf and shawl exports. It also ranked second in women’s cotton dress exports, according to data reported to the United Nations.
The data covers two product categories. HS 6214 includes non-knitted scarves and shawls, while HS 6204.42 covers non-knitted cotton dresses for women and girls. Together, these figures offer insight into India’s role in global apparel and accessories trade.
Key Figures: India’s Export Performance
India held the same position in both categories in 2023 and 2024. However, its share of reported exports changed slightly.
- Scarves and shawls: India ranked fourth among 124 reporting countries in 2024. Exports reached USD 274.7 million, accounting for 7.2% of the reported total of USD 3,837.3 million. In 2023, India also ranked fourth, with a 7.6% share.
- Women’s cotton dresses: India ranked second among 121 reporting countries in 2024. Exports reached USD 844.9 million, representing 16.8% of the reported total of USD 5,041.6 million. India also ranked second in 2023, with a 16.2% share.
However, these rankings include only countries that reported export data to UN Comtrade. Bangladesh, a major garment exporter, did not report data for either year. In addition, Viet Nam and the United Arab Emirates were among the countries that did not report for 2024.
Therefore, the rankings may not reflect the complete global picture. The number of reporting countries also changed between years. For scarves and shawls, 139 countries reported in 2023, compared with 124 in 2024. As a result, readers should not compare the reported shares directly.
Top 10 Scarves and Shawls Exporters in 2024
China led scarf and shawl exports among reporting countries in 2024. France ranked second, followed by Italy. Meanwhile, India secured fourth place.
| Rank | Exporter | Exports (USD million) | Share of reported total |
|---|---|---|---|
| 1 | China | 1,410.2 | 36.8% |
| 2 | France | 797.8 | 20.8% |
| 3 | Italy | 648.5 | 16.9% |
| 4 | India | 274.7 | 7.2% |
| 5 | United Kingdom | 101.8 | 2.7% |
| 6 | Germany | 86.4 | 2.3% |
| 7 | Hong Kong (China) | 59.1 | 1.5% |
| 8 | Spain | 55.3 | 1.4% |
| 9 | Türkiye | 50.8 | 1.3% |
| 10 | Netherlands | 35.1 | 0.9% |
Source: UN Comtrade. Shares represent the combined exports of 124 reporting countries in 2024.
Top 10 Women’s Cotton Dress Exporters in 2024
India ranked second in women’s and girls’ cotton dress exports in 2024. China took the top spot, while Poland came third.
| Rank | Exporter | Exports (USD million) | Share of reported total |
|---|---|---|---|
| 1 | China | 1,213.9 | 24.1% |
| 2 | India | 844.9 | 16.8% |
| 3 | Poland | 439.0 | 8.7% |
| 4 | Morocco | 367.4 | 7.3% |
| 5 | Italy | 336.9 | 6.7% |
| 6 | Türkiye | 329.7 | 6.5% |
| 7 | Germany | 241.2 | 4.8% |
| 8 | France | 216.8 | 4.3% |
| 9 | Hong Kong (China) | 153.7 | 3.0% |
| 10 | Spain | 147.6 | 2.9% |
Source: UN Comtrade. Shares represent the combined exports of 121 reporting countries in 2024.
You can also download the full exporter tables in CSV format. The file includes both product categories, all reporting countries and figures for 2023 and 2024.
What Do the Export Figures Tell Us?
Export value measures the money earned from trade, not the number of items shipped. Therefore, countries selling higher-priced products may rank above those shipping larger quantities.
For instance, France and Italy may benefit from higher-priced fashion and luxury scarves. Hong Kong (China) also acts as a re-export hub. This means its export figures may include goods made in other countries.
Consequently, readers should consider these factors when comparing countries. The rankings show the value of reported exports, but they do not reveal the number of products shipped or the manufacturing origin of every item.
Source and Methodology
The figures come from the UN Comtrade Database. The data uses annual export records under the Harmonized System classification. The figures were accessed through the public API on 7 October 2026.
All values are reported in US dollars and rounded to one decimal place in millions. They are not adjusted for inflation. Each figure reflects the export value that a country reports, with the world as its trading partner.
Finally, the reported total combines exports from countries that submitted data for the relevant year. It does not represent the full value of global exports. For this reason, these rankings compare reporting countries rather than every exporter worldwide.