South Africa Technical Textiles Imports
In July 2023, supplies from abroad of textile products and articles for technical uses decreased by -48.8% to 602 tons for the first time since April 2023, thus ending a two-month rising trend. In general, imports, however, saw slight growth. The pace of growth appeared the most rapid in March 2023 when imports increased by 192% month-to-month.
In value terms, technical textiles imports fell rapidly to $4.3M (IndexBox estimates) in July 2023. Over the period under review, imports showed a slight shrinkage. The most prominent rate of growth was recorded in March 2023 when imports increased by 37% month-to-month.


Imports by Country
India (278 tons), China (243 tons) and Germany (33 tons) were the main suppliers of technical textiles imports to South Africa, together accounting for 92% of total imports.
From July 2022 to July 2023, the most notable rate of growth in terms of purchases, amongst the main suppliers, was attained by India (with a CAGR of +28.0%), while imports for the other leaders experienced a decline.
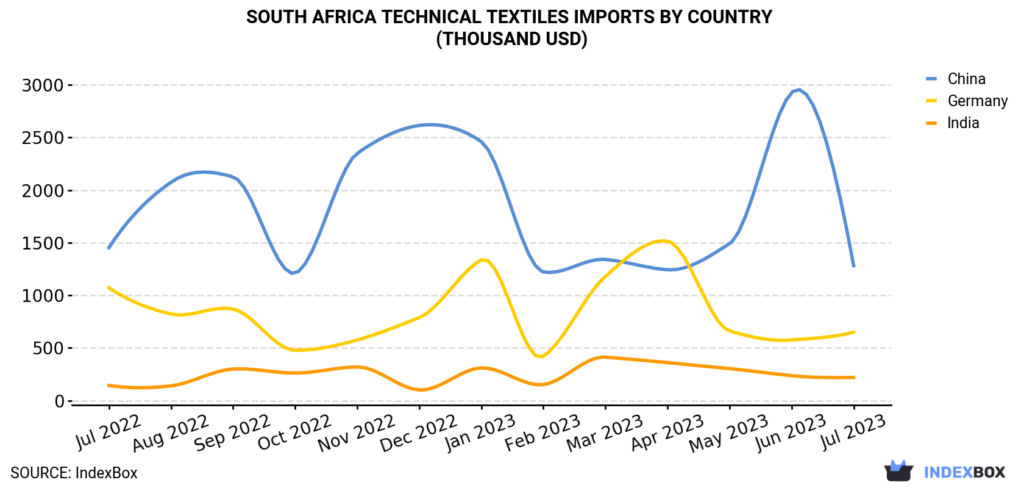
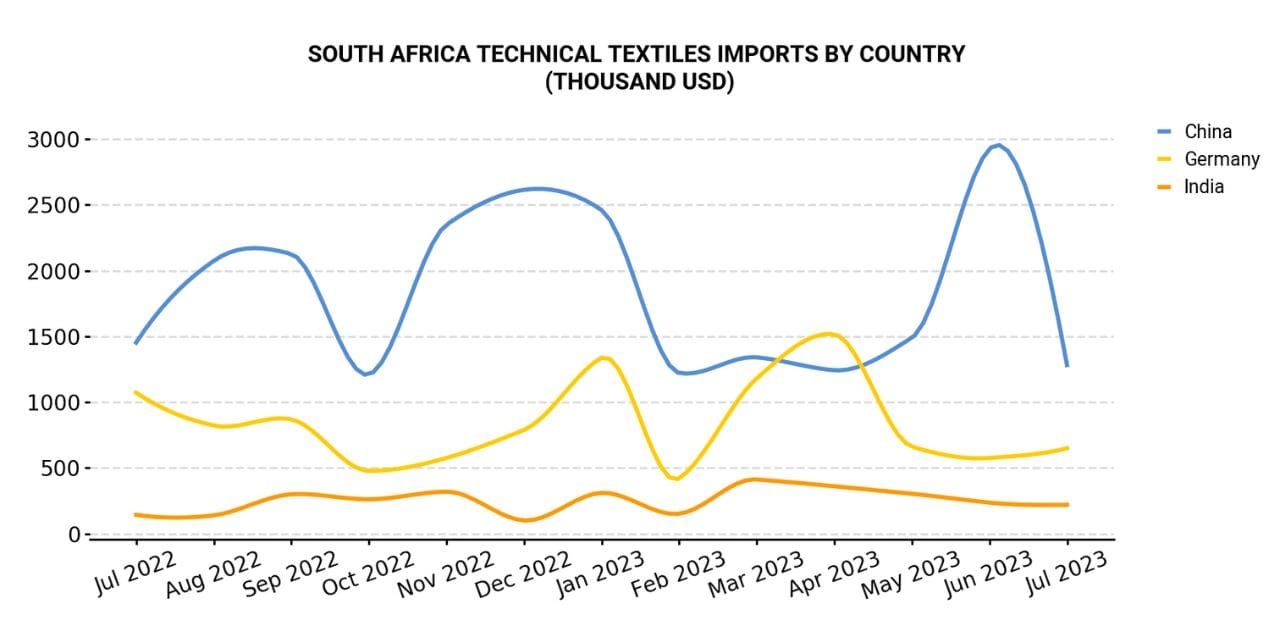
In value terms, China ($1.3M), Germany ($650K) and India ($220K) constituted the largest technical textiles suppliers to South Africa, together comprising 50% of total imports.
India, with a CAGR of +3.6%, saw the highest growth rate of the value of imports, in terms of the main suppliers over the period under review, while purchases for the other leaders experienced a decline.
Imports by Type
In July 2023, textile products and articles for technical uses; specified in note 7 to this chapter (455 tons) constituted the largest type of technical textiles supplied to South Africa, with a 76% share of total imports. Moreover, textile products and articles for technical uses; specified in note 7 to this chapter exceeded the figures recorded for the second-largest type, textiles; transmission or conveyor belts or belting, of textile material, whether or not reinforced with metal or other material (142 tons), threefold. The third position in this ranking was taken by textile hosepiping and similar textile tubing (3.3 tons), with a 0.5% share.
From July 2022 to July 2023, the average monthly growth rate of the volume of import of textile products and articles for technical uses; specified in note 7 to this chapter amounted to +4.9%. With regard to the other supplied products, the following average monthly rates of growth were recorded: textiles; transmission or conveyor belts or belting, of textile material, whether or not reinforced with metal or other material (-4.4% per month) and textile hosepiping and similar textile tubing (+2.2% per month).
In value terms, textile products and articles for technical uses; specified in note 7 to this chapter ($3.5M) constituted the largest type of technical textiles supplied to South Africa, comprising 82% of total imports. The second position in the ranking was held by textiles; transmission or conveyor belts or belting, of textile material, whether or not reinforced with metal or other material ($707K), with a 17% share of total imports. It was followed by textile wicks, woven, plaited or knitted; for lamps, stoves, lighters, candles or the like; incandescent gas mantles and tubular knitted gas mantle fabric therefor, whether or not impregnated, with a 0.9% share.
Import Prices by Country
In July 2023, the technical textiles price stood at $7,095 per ton (CIF, South Africa), with an increase of 38% against the previous month. Over the period under review, the import price, however, showed a pronounced descent. The most prominent rate of growth was recorded in February 2023 when the average import price increased by 102% month-to-month. Over the period under review, average import prices reached the peak figure at $11,585 per ton in October 2022; however, from November 2022 to July 2023, import prices remained at a lower figure.
There were significant differences in the average prices amongst the major supplying countries. In July 2023, the country with the highest price was Germany ($19,475 per ton), while the price for India ($790 per ton) was amongst the lowest.
From July 2022 to July 2023, the most notable rate of growth in terms of prices was attained by China (+2.0%), while the prices for the other major suppliers experienced a decline.

