Ms Nishta Rai, Fashion Management Research Scholar, National Institute of Fashion Technology, Ministry of Textiles, Govt of India.

Dr Vidhu Sekhar P, Assistant Professor, National Institute of Fashion Technology, Ministry of Textiles, Govt of India.
Introduction
The saree has always been one of the most significant garments in Indian culture, carrying meanings of tradition, grace, and identity. Over time, its role has expanded beyond weddings and festivals to include office wear, parties, and even casual occasions. This shift shows how the saree continues to remain relevant while adapting to modern lifestyles.
At the same time, the way people shop for sarees has changed. Instead of relying only on family stores or local markets, buyers now explore options online, compare fabrics, and take inspiration from digital platforms. Social media, in particular, has become a space where sarees are showcased through styling tips, influencer content, and community-driven trends.
To understand these changes, a survey was conducted with 112 respondents from Tier-1 and Tier-2 cities. The questionnaire had 12 focused questions on buying frequency, fabric choices, spending habits, and online engagement. Responses reflected both traditional preferences and modern influences, showing how diverse saree shopping behaviour is today.
Findings revealed that quality and affordability remain key factors, but digital media is steadily shaping how consumers connect with sarees. Younger buyers, especially, are influenced by social media styling and trends, while older consumers remain rooted in cultural and festive wear. The study highlights how saree shopping is no longer just about heritage it is also about how tradition and the digital world come together
This research investigates how saree shoppers make their purchase decisions and how social media influences those choices in the digital era. Using a structured 12-question online survey, responses from 112 participants across Tier-1 and Tier-2 cities were collected and analysed through descriptive statistics and correlation tests. The findings reveal that consumers spend the most on sarees for weddings and festivals, with younger buyers (18–35) purchasing more frequently and experimenting with premium fabrics like silk, while older buyers focus more on traditional occasions. Tier-1 shoppers showed higher spending power compared to Tier-2, highlighting differences in purchasing behaviour by location. Social media emerged as an important factor, with most respondents following saree or fashion-related pages for new designs and discounts, while celebrity endorsements had little influence. Overall, the study concludes that saree buying is no longer shaped by tradition alone but by a combination of cultural values and digital engagement, suggesting that retailers and designers must blend heritage with modern storytelling to meet evolving consumer expectations.
Objectives
To study consumer buying behaviour for sarees, focusing on purchase frequency, fabric/design preferences, and spending patterns.
To examine the influence of social media platforms on consumer engagement, styling choices, and brand discovery in saree shopping.
Literature Review
Chaurasiya and Baxi (2024) showed that consumers primarily notice a brand’s product variety before associating it with slogans or endorsements. They also connected brand preference to traits like “stylish” or “trustworthy,” while stressing that availability often drives final purchases. This suggests that for Navyasa, offering diverse collections with reliable accessibility is as critical as its marketing communication.
Anbalagan (2024) found through a survey of 150 shoppers that cotton (56.7%) and silk (29.3%) were the most favoured fabrics, with quality (35.3%) and design (26%) ranking above price as decision drivers. Most respondents purchased sarees in the ₹1,000–₹5,000 range and were strongly influenced by family members. For Navyasa, this means positioning itself in the affordable premium segment with emphasis on high-quality cotton sarees and vibrant designs, while also tapping into family-driven buying contexts.
Dutta and Sharma (2022) studied social media “saree pacts” where communities share styling narratives and regional weaves using hashtags like #SareeStories. These online interactions not only generate emotional connections but also guide purchase decisions by amplifying peer influence. For Navyasa, this highlights the need to leverage user-generated content, influencer tie-ups, and cultural storytelling to boost brand visibility.
Pandey and Rao (2024) compared online and offline retail preferences, noting that while online platforms provide convenience and choice, offline stores build trust through tactile experiences. They recommended an omnichannel strategy combining both. Since Navyasa operates across online and selective offline channels, a seamless integration of digital campaigns with in-store storytelling will be essential to build brand loyalty.
Research Methodology
This study employed a quantitative research approach to investigate consumer preferences in the saree market, with a specific focus on purchase behaviour, and perceptions . The objective was to identify the key factors influencing consumer decision-making when purchasing sarees, such as design, fabric, price, occasion, and quality.
Survey Design
A structured questionnaire was designed to collect primary data, comprising both closed-ended and open-ended questions. The survey consisted of 12key questions which covered demographic factors, as well as consumer attitudes toward saree purchase frequency, occasions, preferred fabrics, design elements, price range.
Sample and Demographics
The sample consisted of 112 respondents from urban Tier-1 and Tier-2 cities, representing the key consumer base for branded sarees. The age groups ranged from under 18 to 55+, with strong representation from both younger and older consumers. The majority of respondents were female, reflecting the core target audience for saree purchases. Occupations included professionals, homemakers, students, and entrepreneurs, ensuring insights captured the perspectives of both traditional buyers and modern urban consumers.
Data Collection and Analysis
Data was collected through online surveys and analysed in JASP using descriptive and inferential methods. Descriptive findings mapped consumer preferences for fabrics, price ranges, and occasions, while ANOVA highlighted differences across age, occupation, and city tiers. Correlation analysis showed links between brand awareness, social media following, fabric choice, and price range, providing actionable insights for strengthening Navyasa’s positioning.
Data Interpretation and Analysis
- Corelation
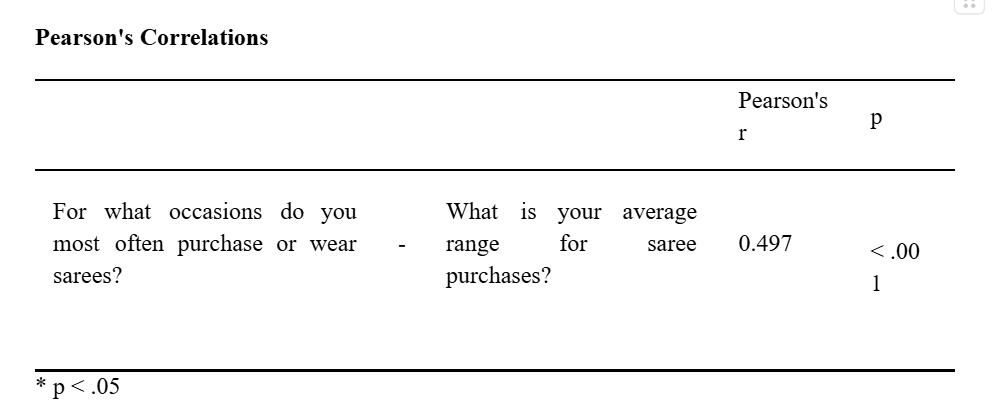
Occasions you most often purchase or wear sarees- Average range for saree purchase.
Null hypothesis (H0): There is no linear relationship between the occasions for which sarees are purchased or worn and the average price range of saree purchases (ρ=0ρ=0).
Alternative hypothesis (H1): There is a linear relationship between the occasions for which sarees are purchased or worn and the average price range of saree purchases (ρ≠0ρ=0).
Interpretation
The Pearson correlation coefficient of 0.497 indicates a moderate positive relationship between saree purchase occasions and average spending. This means that as the significance or type of occasion increases, consumers tend to spend more on sarees. The p-value (< 0.001) confirms this relationship is statistically significant, so the observed correlation is unlikely due to chance.
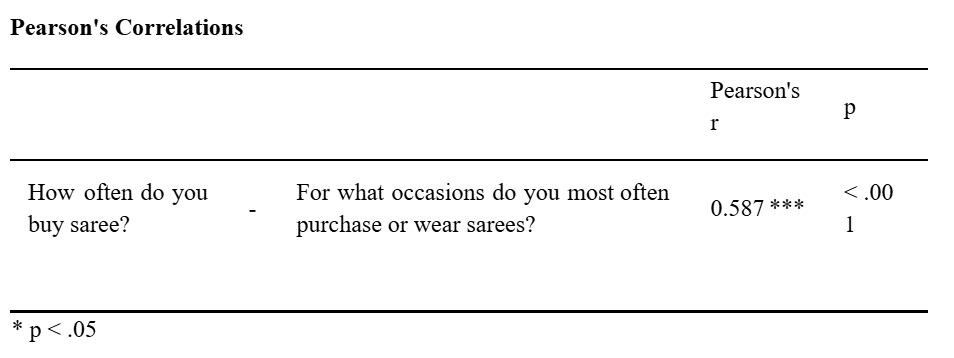
Correlation 2. How often do you wear a saree – What occasions do you most often purchase or wear sarees.
Null hypothesis (H0): There is no linear relationship between the occasions for which sarees are purchased or worn and the average price range of saree purchases (ρ=0ρ=0).
Alternative hypothesis (H1): There is a linear relationship between the occasions for which sarees are purchased or worn and the average price range of saree purchases (ρ≠0ρ=0).
Interpretation
The Pearson correlation coefficient of 0.587 indicates a strong positive relationship between purchase frequency and purchase occasions. The p-value (< 0.001) shows this relationship is statistically significant, meaning consumers who buy sarees more frequently tend to purchase them for a wider variety or more significant occasions.
Correlation-3 How often do you buy sarees – Average range for saree purchases.
Null hypothesis (H0): There is no linear relationship between how often consumers buy sarees and their average spending range (ρ=0ρ=0).
Alternative hypothesis (H1): There is a linear relationship between how often consumers buy sarees and their average spending range (ρ≠0ρ=0).
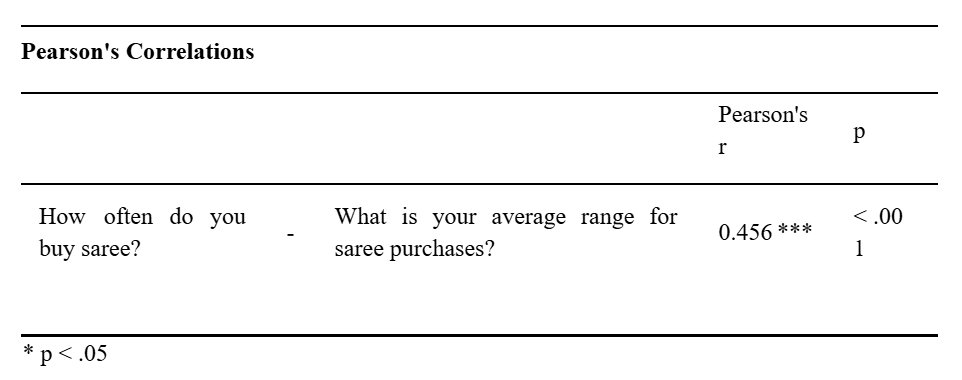
Interpretation
The Pearson correlation coefficient of 0.456 indicates a moderate positive relationship between purchase frequency and average spending on sarees. The p-value (< 0.001) shows this correlation is statistically significant, suggesting consumers who buy sarees more frequently tend to spend more per purchase.
Correlation 4. City/Town – Average range for saree purchases.
Null hypothesis (H0): There is no linear relationship between how often consumers buy sarees and their average spending range (ρ=0ρ=0).
Alternative hypothesis (H1): There is a linear relationship between how often consumers buy sarees and their average spending range (ρ≠0ρ=0).
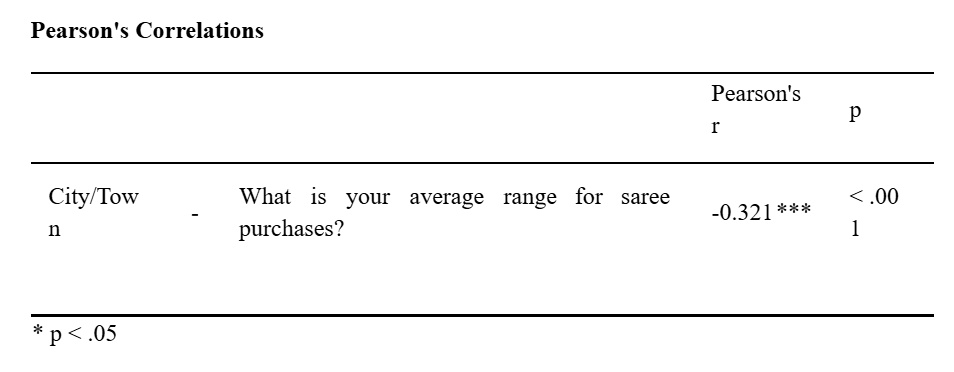
Interpretation: The Pearson correlation coefficient of -0.321 indicates a moderate negative relationship between city/town and average spending on sarees. The p-value (< 0.001) confirms that this negative correlation is statistically significant. This means that as the city/town changes (likely from Tier 1 to Tier 2), the average spending on sarees tends to decrease.
ANOVA test -Age Group – How often do you buy sarees?
Null hypothesis (H0): There is no difference between how often consumers buy sarees and their average spending range (ρ=0ρ=0).
Alternative hypothesis (H1): There is difference between how often consumers buy sarees and their average spending range (ρ≠0ρ=0).
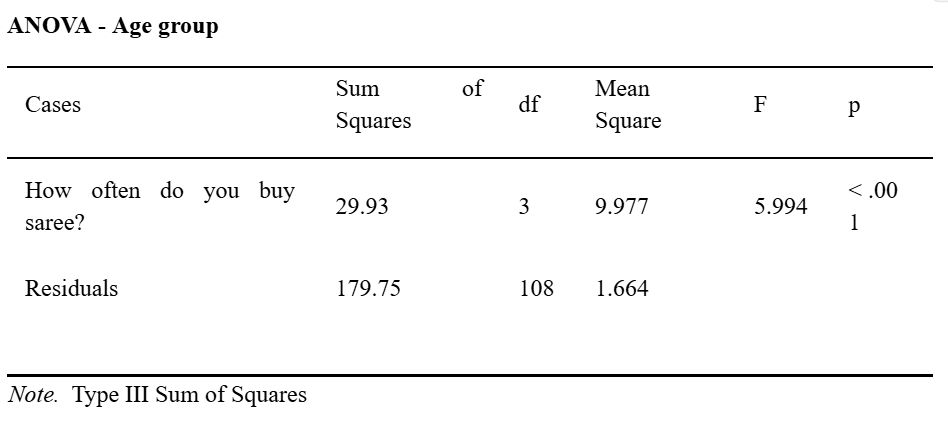
Interpretation : – The ANOVA results show an F-value of 5.994 with a p-value less than 0.001, indicating a statistically significant difference in how often sarees are purchased among the different age groups. This means that age influences purchase frequency at a statistically significant level.
ANOVA Test Age Group – What occasions do you most often purchase or wear Saree.
Null hypothesis (H0): There is no difference between how often consumers buy sarees and their average spending range (ρ=0ρ=0).
Alternative hypothesis (H1): There is a difference between how often consumers buy sarees and their average spending range (ρ≠0ρ=0).
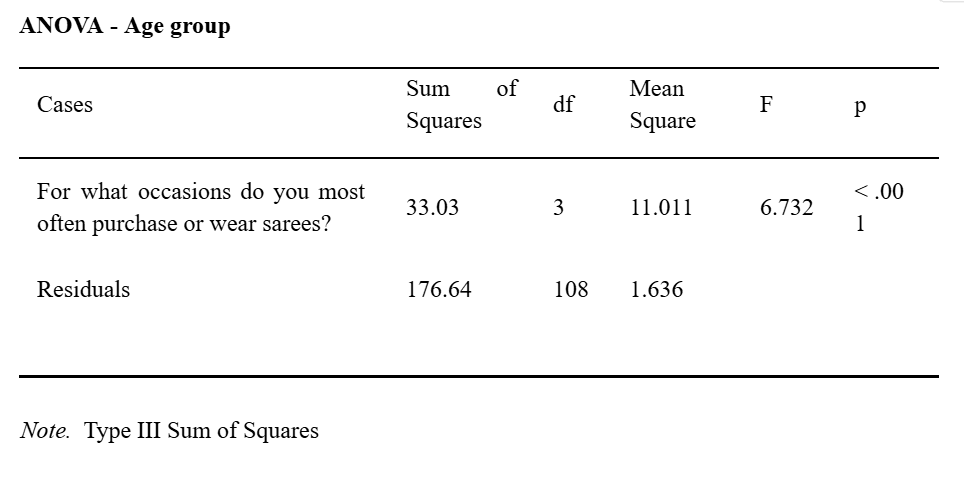
Interpretation: The ANOVA results show an F-value of 6.732 with a p-value less than 0.001, indicating a statistically significant difference in saree purchasing occasions among different age groups. This means that age has a significant effect on the type of occasions for which consumers buy or wear sarees.
ANOVA Test-Fabric you would pay more for – How often do you wear saree.
Null hypothesis (H0): There is no difference between how often consumers buy sarees and their average spending range (ρ=0ρ=0).
Alternative hypothesis (H1): There is difference between how often consumers buy sarees and their average spending range (ρ≠0ρ=0).
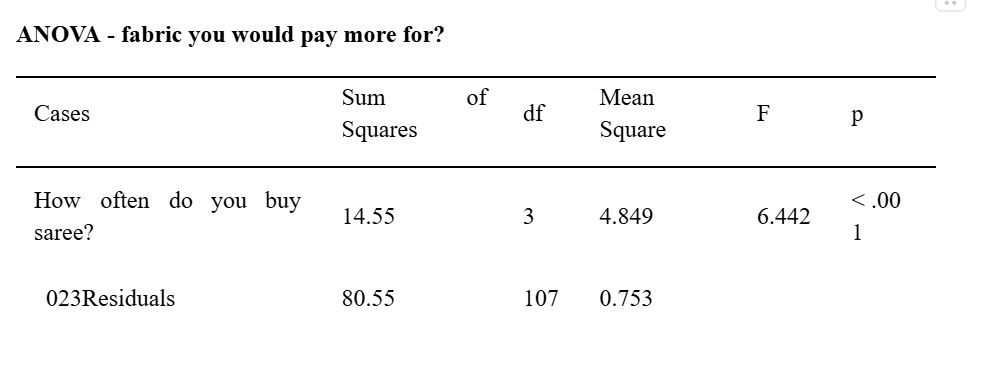
Interpretation: The ANOVA results show an F-value of 6.442 with a p-value less than 0.001, indicating a statistically significant difference in fabric preferences among groups based on purchase frequency. This means that how often consumers buy sarees significantly affects the type of fabric they are willing to invest in.
Findings
Relationship Between Occasion and Spending
Statistical analysis (Pearson correlation, r = 0.497, p < 0.001) indicated a clear link between the type of occasion and the amount spent on sarees. Weddings and festivals were associated with higher budgets, while sarees purchased for everyday or casual use tended to be lower priced. This suggests that purchase context strongly shapes willingness to pay.
Purchase Frequency and Occasion Diversity
A positive relationship (r = 0.587, p < 0.001) was observed between how often consumers buy sarees and the variety of occasions for which they purchase them. Those who shop frequently tend to buy sarees for multiple reasons—including festivals, weddings, and workwear—demonstrating that frequent buyers are more engaged with the category overall.
Purchase Frequency and Expenditure
Another significant correlation (r = 0.456, p < 0.001) showed that individuals who purchase sarees more regularly also tend to spend more per purchase. This identifies a niche consumer base that is both high-spending and high-frequency, making them especially valuable to brands.
Impact of Age on Buying Patterns (ANOVA)
Age was found to significantly influence both the frequency of saree purchases (F = 5.994, p < 0.001) and the occasions linked to buying (F = 6.732, p < 0.001). Younger participants (18–35) purchased sarees more often, especially for professional and social settings, whereas older participants were more likely to buy sarees for traditional events such as weddings and religious festivals.
Fabric Preference and Frequency (ANOVA)
The ANOVA test (F = 6.442, p < 0.001) also revealed that frequent buyers prefer premium fabrics like silk, whereas occasional buyers lean towards cotton and other affordable materials. This demonstrates how fabric preference aligns with buying frequency and budget.
Recommendations
Findings show that buyers aged 18–35 purchase sarees more frequently and experiment with premium fabrics like silk. Brands should focus marketing campaigns, product launches, and social media engagement on this segment to maximize returns.
Since purchase frequency correlates with occasion variety, brands can highlight sarees suitable for weddings, festivals, professional wear, and casual settings. Occasion-specific collections and styling tips can encourage more frequent purchases.
Social media is a key influencer for purchase decisions. Sharing new designs, discounts, styling reels, and user-generated content can strengthen engagement and help consumers discover the brand.
Tier 1 city respondents spend more on sarees than Tier 2, indicating differences in purchasing power. Brands should position premium collections for Tier 1 cities while offering affordable options and promotions for Tier 2 cities.
Frequent buyers prefer silk and are willing to invest more. Brands should highlight premium fabrics in their collections and provide detailed online information on fabric quality to justify higher pricing.
Correlations between purchase frequency and spending suggest that repeat buyers are valuable. Personalized recommendations, newsletters, and social media reminders can help retain these consumers and increase overall spending.
Conclusion
The study reveals key insights into the saree market, particularly among young buyers aged 18-35 who frequently purchase and experiment with premium fabrics like silk. To capitalize on this trend, brands should focus on this demographic through targeted marketing, occasion-specific collections, and enhanced social media engagement. By highlighting premium fabrics, providing styling tips, and offering personalized recommendations, brands can encourage repeat purchases and increase spending. Additionally, tier-specific strategies can help brands cater to varying purchasing powers in different cities. By leveraging these findings, brands can strengthen their market presence and drive growth in the saree segment.
References
Chaurasiya, P., & Baxi, S. (2024). Consumer perception towards brand choice and loyalty in apparel retailing. Proceedings of the 15th International Conference on Computer Science and Information Technology (ICIST 2023).
Anbalagan, K. (2024). A study on consumer preference towards sarees with special reference to Ramachandran Retail. Journal of Emerging Technologies and Innovative Research (JETIR).
Sandhu, A. (2022). When sarees speak: Saree pacts and social media narratives. Feminist Theory, 23(3), 386–406.
Pandey, R., & Rao, S. (2024). Online vs. offline retail in fashion: A comparative study of consumer satisfaction and loyalty. IOSR Journal of Business and Management, 24(10), 20–26.